International Quilt Study Center & Museum: Quilt Timeline

Komodo Media. (2013). Quilt Timeline Explorer. International Quilt Study Center & Museum. Educational. Retrieved from http://explorer.quiltstudy.org/timeline.html
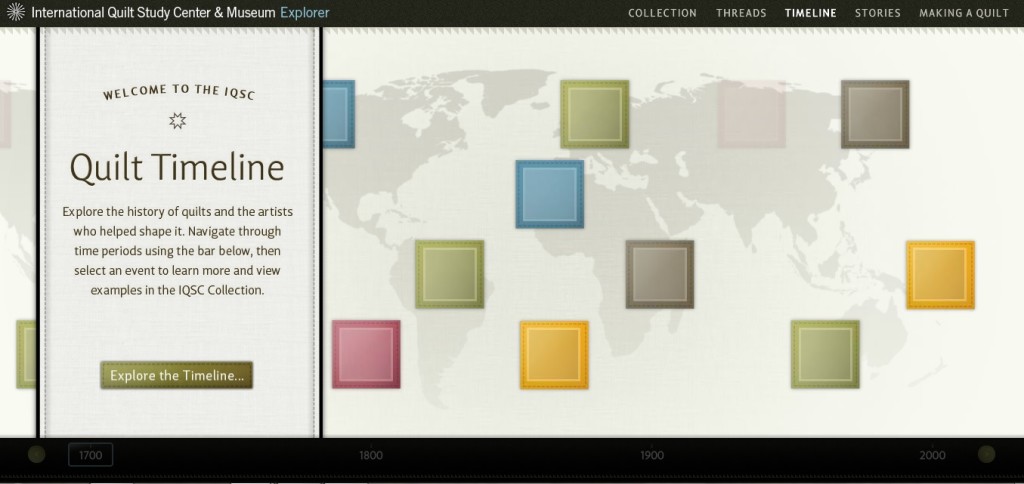
This still image does not do the homepage for this time-series information visualization justice. One the IQSCM website the map floats from right to left, giving you the impression of the globe scrolling/rotating by and of time progressing forward. It is further animated with colored patches that zoom forward from points on the globe. Once you click to ‘Explore the Timeline’ you are taken to a curated starting point in the middle of the information, c1850 – notably the era of the U.S. Civil War.
You can move around on the timeline by clicking or sliding the mouse, but you cannot zoom out and view the entire dataset. In order to analyze the significant entries on the timeline, and do the brainstorming above, I had to create something supplemental for analytical purposes, which Few describes as necessary in the “Time Series Analysis” chapter of Now You See It. The dataset for this visualization is curated for the purpose of display by; so, while the horizontal axis represents time, it is not immediately clear if the time points can be interpreted quantitatively like a scatterplot. As Aigner, et al, discuss in “Visual Methods for Analyzing Time Oriented Data”, it is hard to set parameters for the periodic entries into a dataset, and this visualization is composed of curated examples from a dataset of quilts in the collection of one institution. The authors would also recognize the role temporal data abstraction plays in the IQSCM’s decision to use qualitative values/patterns for this visualization. Since there isn’t a key, I made a table in MS Word to look for qualitative meaning to the colors of the highlighted rectangular patches:

Observations
- Yellow describes significant quilt movements that are “Eastern”, “Japanese”, and “Exotic”
- Pink describes “Innovation”, “Machine Quilting”, and “New Perspectives”
- Blue describes “Religious”, “Political”, and “Social”
- Green describes “Albums of Memories”, “Celebrations in Quilts”, and “Daily Life”
- Yellow precedes blue, green and pink 2x : hypothesis: In the past 250+ years of quilting there has been a cycle (repeated 2x @ ~130 yrs./cycle) where the “East”, particularly China, India, and Japan, exerts an influence on American quilting for a period of 50-80 years; this is followed by technological developments and the exploration of domestic issues by quilters.
- Pink precedes green 2x : hypothesis: Technological developments inspire quilts used to archive quilters’ life experiences and/or the time period.
- Green precedes blue 2x : hypothesis: The production of quilts that archive a personal experience leads to the production of quilts that archive a larger American experience.
- Green precedes pink 2x : hypothesis: Archival quilts inspire technological innovations.
- Green and blue overlap 2x : hypothesis: Quilts that archive personal and community experiences are often produced at the same time.
- There is a brief flurry of 3 quilt movements in ~20 years (1970-1989) : hypothesis: Machine quilting technology was used by academically/artistically trained quiltmakers; this plus the introduction of a new tool in 1979 (the rotary cutter), inspired a general archival movement in quilting.
- There is no data on the timeline for 1933-1970 or 1989-present, both ~30 year periods :
- hypothesis 1: These quilts are still in the possession of the quiltmakers and their families, they may be donated to IQSCM in the future, at which point there will be enough data to recognize thematic movements;
- hypothesis 2: Quilting was negatively impacted by the second and third waves of the feminist movement in the United States;
- hypothesis 3: If this is a cycle, then quilts made during 1933-1970, information not included in this dataset, are most likely blue; they most likely reflect American issues from that 35 year period, such as WWII and the Civil Rights Movement;
- hypothesis 4: The quilts made in the U.S. from 1989 to present are more likely to be personal archival quilts (for recording memories, celebrations, and life) than they are to be quilts inspired by foreign textile designs. The AIDS Quilt was initiated in 1987 by a small group in San Francisco “to document the lives they feared history would neglect”; currently the AIDS quilt is the largest community art project in the world, 1.3 million square feet with over 48,000 3‘ x 6’ panels and over 94,000 names.
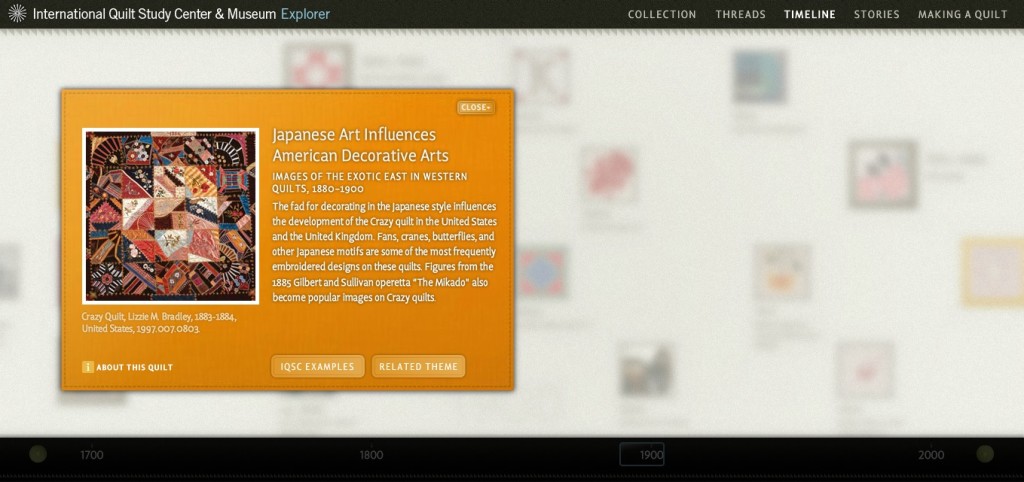
Beyond the color coding of highlighted information, the visualization fits as well with the observations of Aigner, et al about analyzing time-oriented data. Keim’s steps as stated in their article – show the important, zoom & filter, analyze further, details on demand – are also present in the Quilt Timeline; your eye is drawn to the highlighted rectangle, and when you click on it you have the option to zoom to other related topics/time periods.

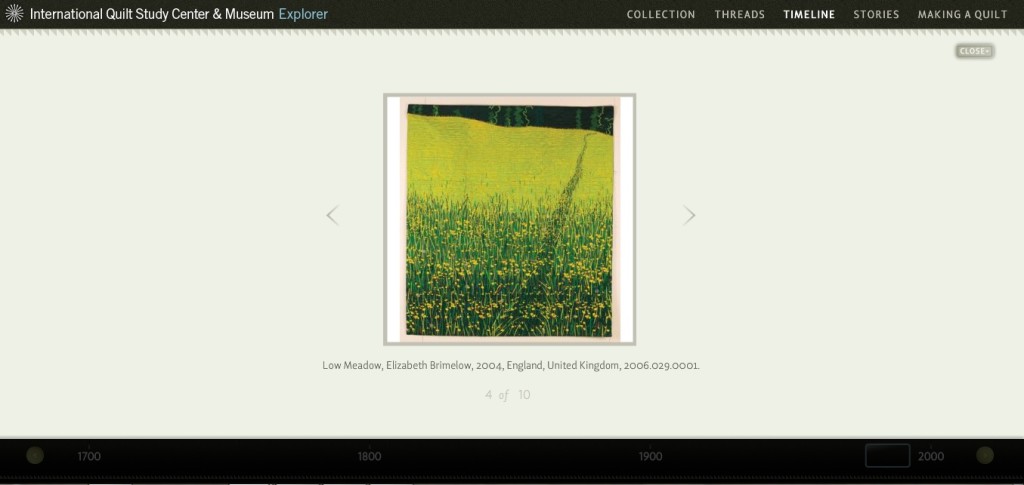
You can analyze the theme further by clicking “IQSC Examples” to see other selected quilts, and for details on demand click on “About This Quilt”.

